Part 2: The Economics of Crime, a brief;
risk preference and satisfaction
Liam Scotchmer
References and calculations listed below.
4 Minute Read
However irrational you think it may be to commit a crime, it differs no less than from other theories of human behaviour: "“[it] does not require ad hoc concepts of differential association, anomie, and the like, nor does it assume perfect knowledge.”
This quote comes from a research paper by Gary Becker (I think he is quite famous) linked here. That research paper is what this article is based on. What Becker is saying, is that whilst we don’t assume people always have perfect knowledge or always make rational decisions, people do consider the costs and benefits of their actions that usually “result in an optimal level of benefit or utility” (Hayes, 2024),. And Becker believes this is even the same with criminals. Criminals weigh the cost and benefits of their crimes - “some persons become criminals, therefore, not because their basic motivation differs from that of other persons, but because their benefits and costs differ.” (Becker, 1974)
What an interesting point of view. So, we can think of crime like any other human behaviour – an individual considers their costs, benefits, and chooses the one with the greatest utility (utility means satisfaction/benefit, remember this). This is not to say criminals always make rational decisions, sometimes they compute it incorrectly and it leads to an overproduction of crimes.
The biggest factors Becker believes that affect the costs and benefits of a crime is the probability of being caught (p) and the severity of punishment (f). When these increase, the EU from a crime decreases, and the same goes inversely. This makes sense… and it is nothing groundbreaking. This is in general too, it affects every kind of person who has some or no tolerance for risk.
But what isn’t in general is u - in the formula, u is a “portmanteau” of things.. it’s a function. It changes for each individual. An obvious example might be some individuals have greater utility from crime due to having a lower income, or lower education (thus less “law-abidingness”), so they get greater utility from illegal activity versus legal activity…. but what one contributor he touched on was u being risk preference type.
What is your risk preference? Are you risk neutral (linear u), averse (concave u) or risk preferred (convex u)? This shapes the curve (shown below). From that, people have different expected utilities from committing a crime, and they also evaluate the risky payoff differently. Therefore, the police are not just up against reducing p or f, but also crime pays depending on how you value uncertainty.
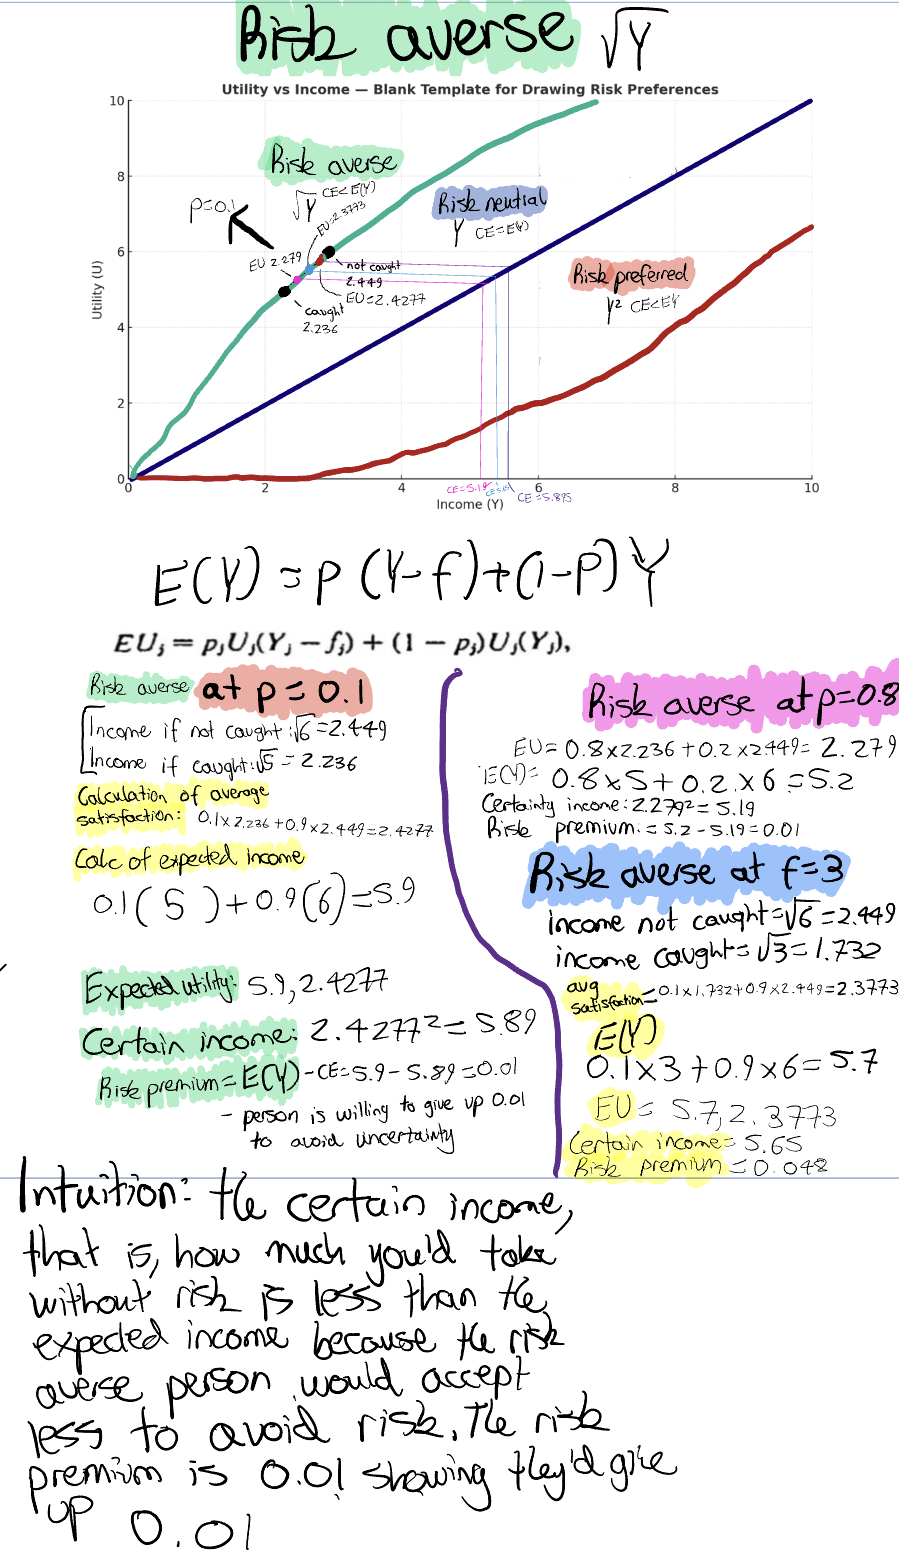
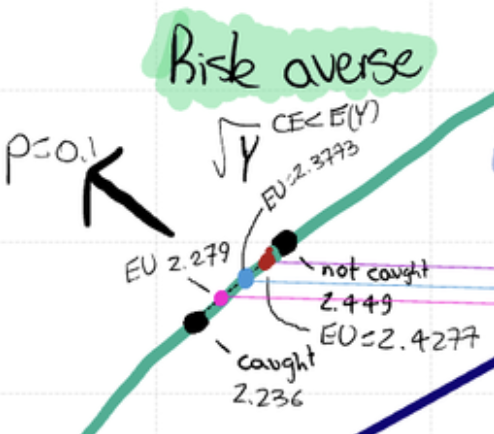
I did run the numbers (they are below) and for a risk averse individual, their expected utility (satisfaction) is lower than risk neutral and risk preferred - makes sense, they don’t get a good thrill from committing crimes. Additionally, their certainty equivalent (CE) < the crimes expected income. The intuition behind this is, the risk averse individual would rather take the CE - the guaranteed return that they can have now, instead of the crimes expected income. They would take less just to avoid the crime! (5.89 CE < 5.9 E(Y))
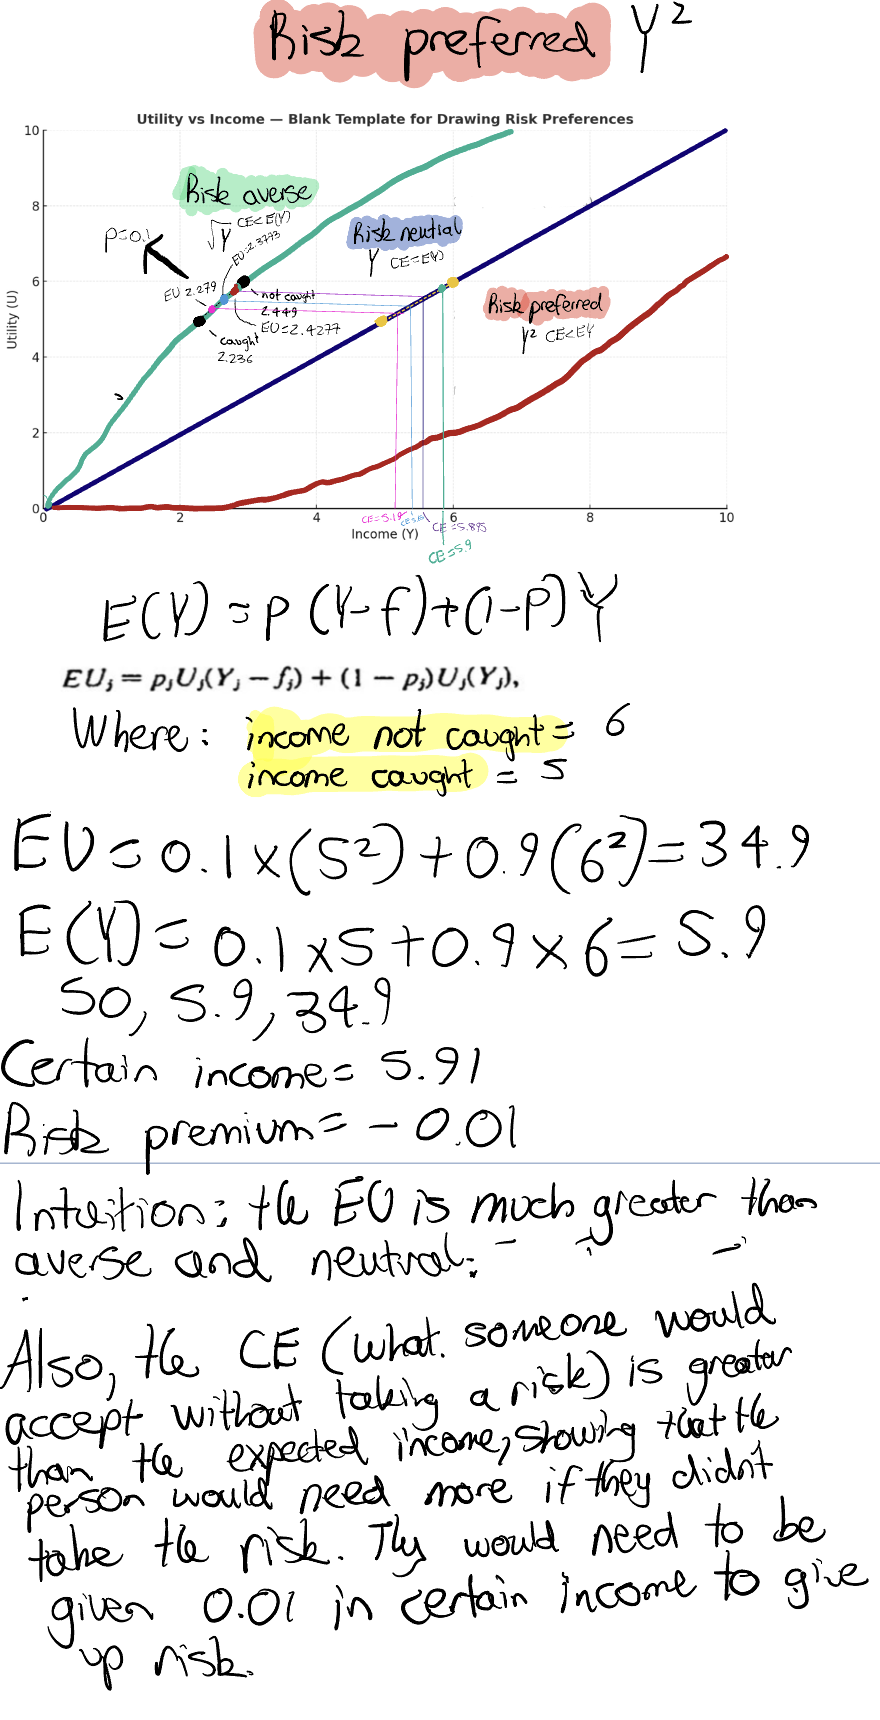
It’s the opposite case for a risk preferred individual, who’s CE > the crimes expected income. This means they’d rather take a risky bet and try to gain more than the expected income. (5.91 CE > 5.9 E(Y))
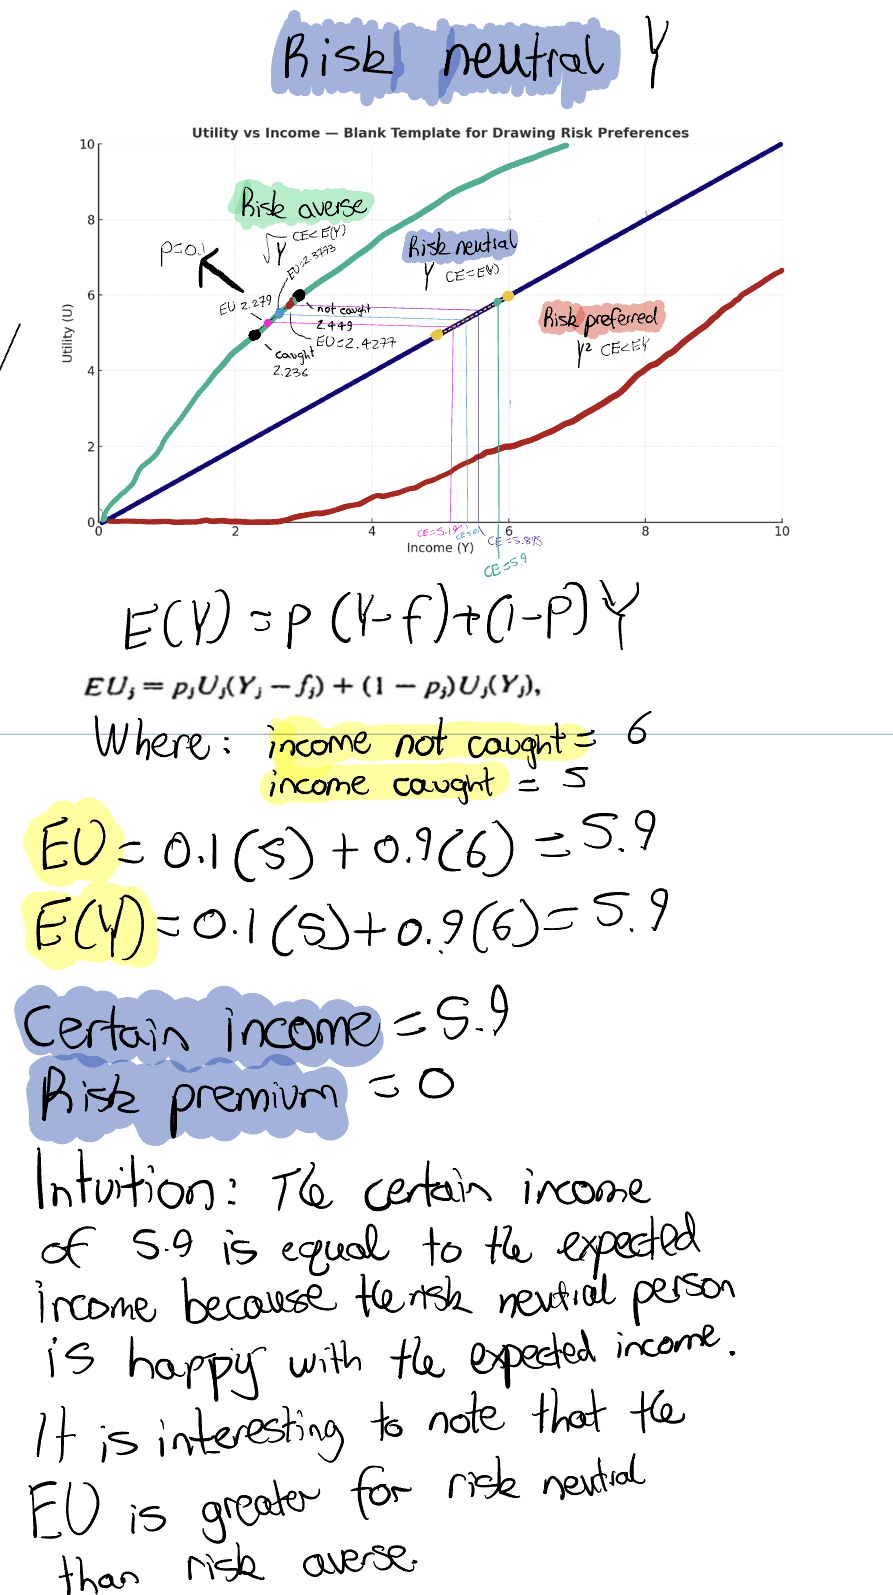
For a risk neutral individual, they are indifferent - they don’t care about risk. Their CE is equal to expected income of 5.9.
In part 2 of 3, we dive into the economics of crime!
Part 2: Economics of Crime, a brief:
“A person commits an offense if the expected utility to him exceeds the utility he could get by using his time and other resources at other activities. Some persons become "criminals," therefore, not because their basic motivation differs from that of other persons, but because their benefits and costs differ.” (Becker, 1974)
But what happens when a criminal knows their probability of being caught and can exploit it?
I read another article on this subject linked here and the golden state killer was used as an example. He was able to exploit his probability of being caught - he was a cop! He knew how to avoid detection, so his p value when down, and therefore his EU went up. This is all despite him being risk averse. In math terms, when I decrease his p value to 0.05 (quite a bit adjustment), and increase f (so decrease income if caught), his expected utility decreases barely from our previous 2.428 to 2.427. So, with an EU that decreased by so little, no wonder he was a serial killer for so long… that is, until police could do fingerprint reading and his p value shot back up so he stopped! (Corcoran n.d.) Interesting stuff!
…
For those who want to understand more:
We can compute the expected utility using the following formula:
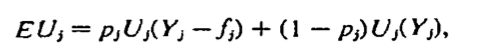
(Becker 1974)
Probability being caught (P) x utility of income after punishment (Y-f) + probability of not being caught x utility of income from not being caught.

(Becker 1974)
The above formula goes on the y axis, and on the x axis goes the expected income:
Not too hard, right? But where it got interesting is when Becker split individuals into three categories:
Risk averse = concave curve
Risk neutral = linear curve
Risk preferred = convex
Derived by:
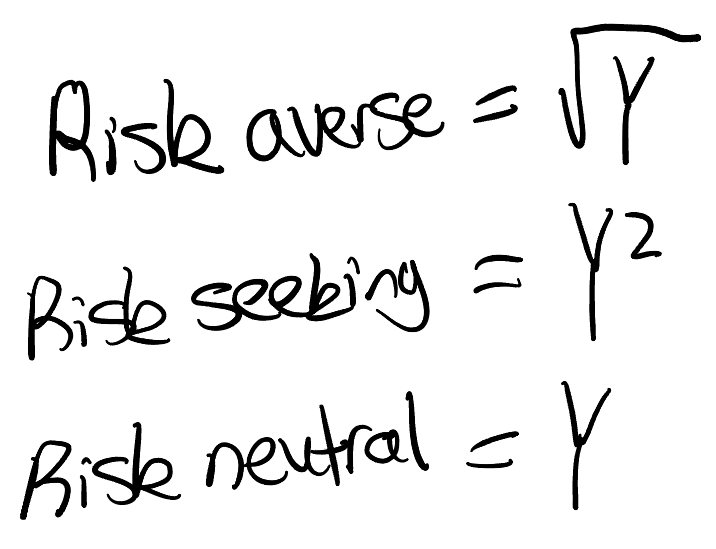
(Franz 2025)
And when I graphed it, it looked like this:
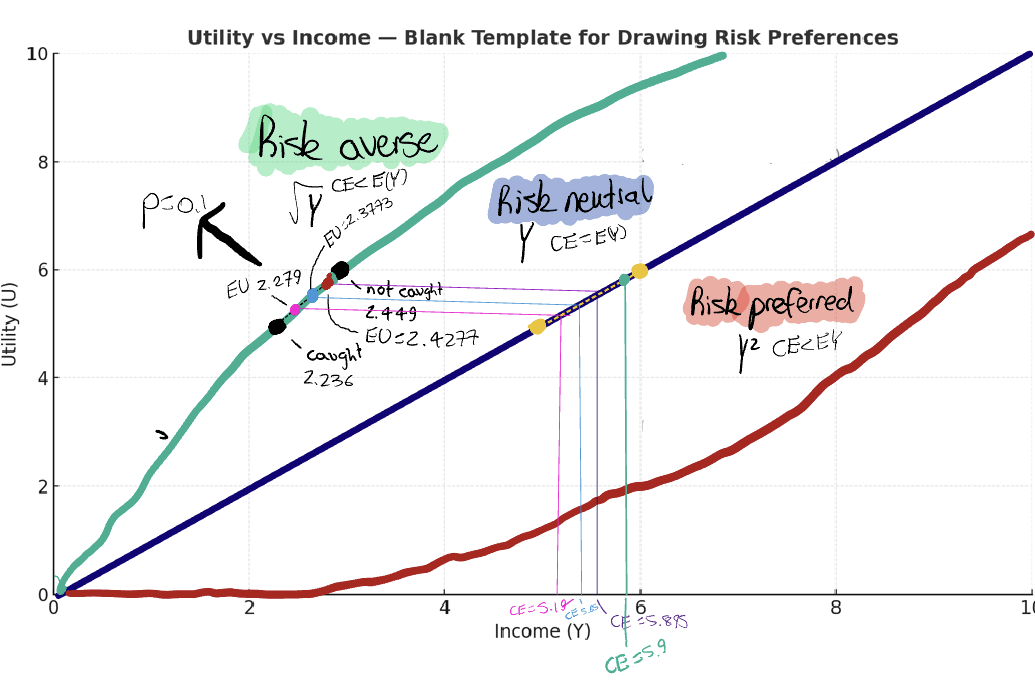
Graph template made using ChatGPT.
For risk neutral, let’s call this linear curve our benchmark curve- it its the average money payoff or expected income.
A risk neutral individual is indifferent between committing and not committing a crime. Therefore, their CE (5.9) is equal to their expected income E(Y) = 5.9. They are the same because they are indifferent between committing and not committing a crime.
HOWEVER,
for risk averse, the curve is concave - it slopes upwards quickly, but then flattens, because they receive less satisfaction per dollar stolen than the one before. The CE is 5.89, whilst the expected income is 5.9. This is because they would rather take less, than commit the crime and receive the expected income.
For risk preferred, the curve is convex.
The reason the risk preferred curve goes up is because for a risk preferred individual, they receive greater satisfaction per dollar earned than the one before. The CE is 5.91, this is greater than the expected income of 5.9. Therefore, this individual would rather take the risky bet and earn more than the expected income.
In summary, “in equilibrium, the expected incomes of persons in risky activities are, at the margin, relatively high or low as persons are generally risk avoids or preferrers” - what Becker is saying agrees with my math calculations:
expected income = 5.9
CE for averse = 5.89 (so expected income higher)
CE for preferred = 5.91 (so expected income lower)
An aside:
Factors affecting EU (satisfaction)
P and F
If P and/or F rise, EU falls.
If P and/or F fall, EU rises. Makes sense! I even graphed this below:
When I increase p or f, all else equal, it moves an individual (their dot) closer to the "caught” dot… so their EU decreases. This makes sense - when you increase policing or punishment severity, crime falls… this is shown below:
However, as seen in this next graph, governments aren’t just up against p or f, but also people’s risk preference:

I had chatGPT create me this graph. You can see that a risk preferred person (red) will still commit a crime even when there’s a high prob of being caught. The green line (risk neutral) is indifferent, and the risk averse (blue) is much less likely to commit a crime.
So does crime pay? Well, it is an “implication of the attitudes offenders have toward risk and is not directly related to the efficiency of the police or the amount spent on combating crime. If, however, risk were preferred at some values of p and f, and disliked at others, public policy could influence whether “crime pays” by its choice of p and f.” (Becker, 1974)
Interesting stuff. I probably dumbed it down too much for you, but for me this is quite complex. I am unsure if all of this is correct, but in my head it is.
Thank you for reading.
REFERENCES:
Full disclosure- ChatGPT was used to help me understand Gary Becker’s research paper (his words are very technical), and fact check everything, however ChatGPT was never used to write anything or to perform any calculations.
Bahrani, Mahmoud. “The Economics of Crime with Gary Becker.” Chicago Maroon, 2012, chicagomaroon.com/15630/grey-city/the-economics-of-crime-with-gary-becker/.
Becker, Gary. “Chapter Title: Crime and Punishment: An Economic Approach Crime and Punishment: An Economic Approach.” National Bureau of Economic Research, vol. ISBN, 1974, pp. 0–87014, www.nber.org/system/files/chapters/c3625/c3625.pdf.
Corcoran, Kevin. “Rational Crime and Subjective Probability - Econlib.” Econlib, 8 Jan. 2025, www.econlib.org/rational-crime-and-subjective-probability/.
Downey, Lucas. “What Are Transaction Costs? Definition, How They Work, and Example.” Investopedia, 30 Apr. 2021, www.investopedia.com/terms/t/transactioncosts.asp.
FATF. ““Black and Grey” Lists.” Www.fatf-Gafi.org, 2024, www.fatf-gafi.org/en/countries/black-and-grey-lists.html.
Hayes, Adam. “Smurf.” Investopedia, 30 June 2021, www.investopedia.com/terms/s/smurf.asp.
Juma, Andrew. “What Are Transaction Costs? (Types and Examples).” Indeed Career Guide, 2025, www.indeed.com/career-advice/career-development/transaction-costs.
Masciandaro, Donato. “Economics of Money Laundering: A Primer.” SSRN Electronic Journal, 2007, https://doi.org/10.2139/ssrn.970184. Accessed 20 May 2019.
Calculations