
Steepeners and flatteners: Bonds
Liam Scotchmer
References listed below.
4 Minute Read
Intro
If you haven’t read my previous article on bond yields, here’s a quick TLDR (is that how the cool kids say it..?)
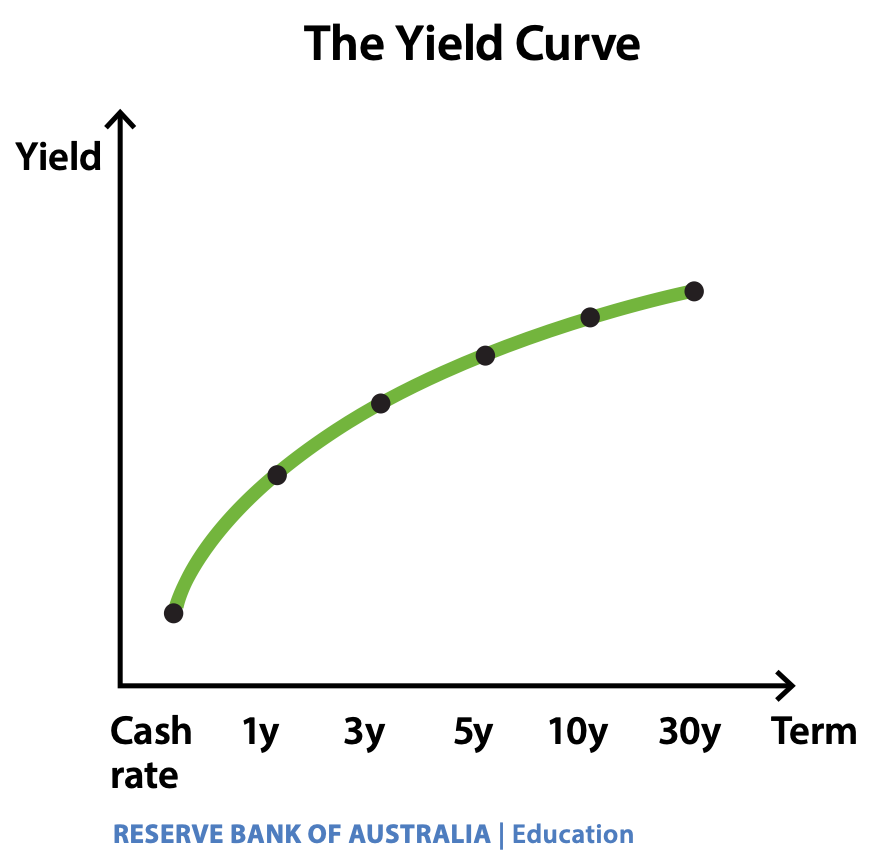
The yield curve shows the yield on bonds over different terms to maturity, or in other words, if you plot the interest rate of bonds from 0 to 30 years, you get a graph that looks like the one below. (RBA 2025) This is what a normal yield curve looks like. (Millennial revolution 2023)
A quick recap on the slope of the yield curve
According to the Reserve Bank of Australia (n.d.)
The normal yield curve has a short term yield that is less than the long term yield.
A flat curve is when short term yields are similar to long term bond yields
And an inverted yield curve is where short term yields are greater than long term bond yields.
All shown below:

this article was written using an article from forex training group, found at:
https://forextraininggroup.com/understanding-quantitative-easing-by-the-fed/
Flattener - bull and bear
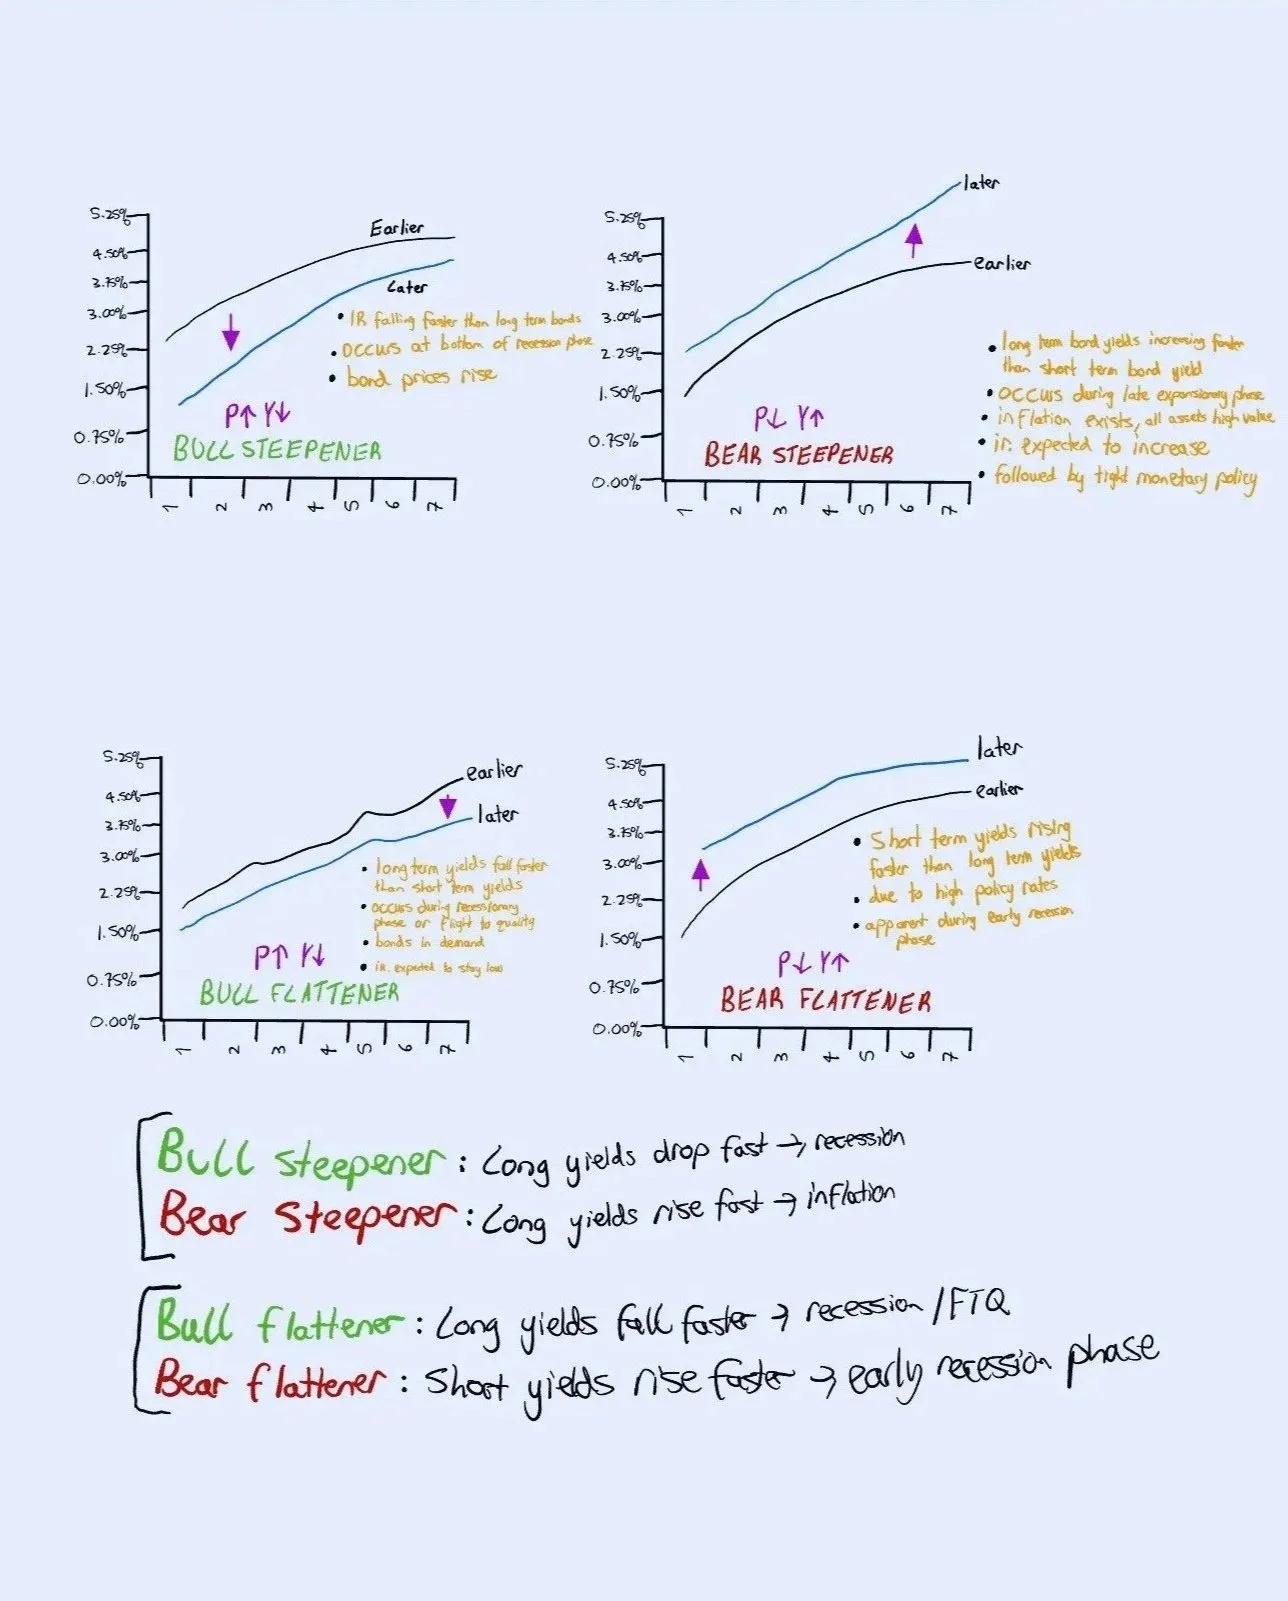
In addition to the above variations of yield curves, there are more. They are specifically on the formation of the yield curve: they are called the bull flattener and bear flattener.
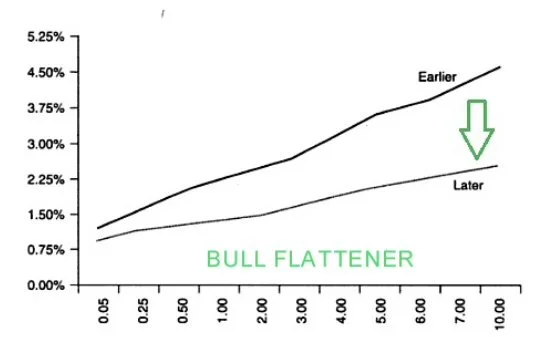
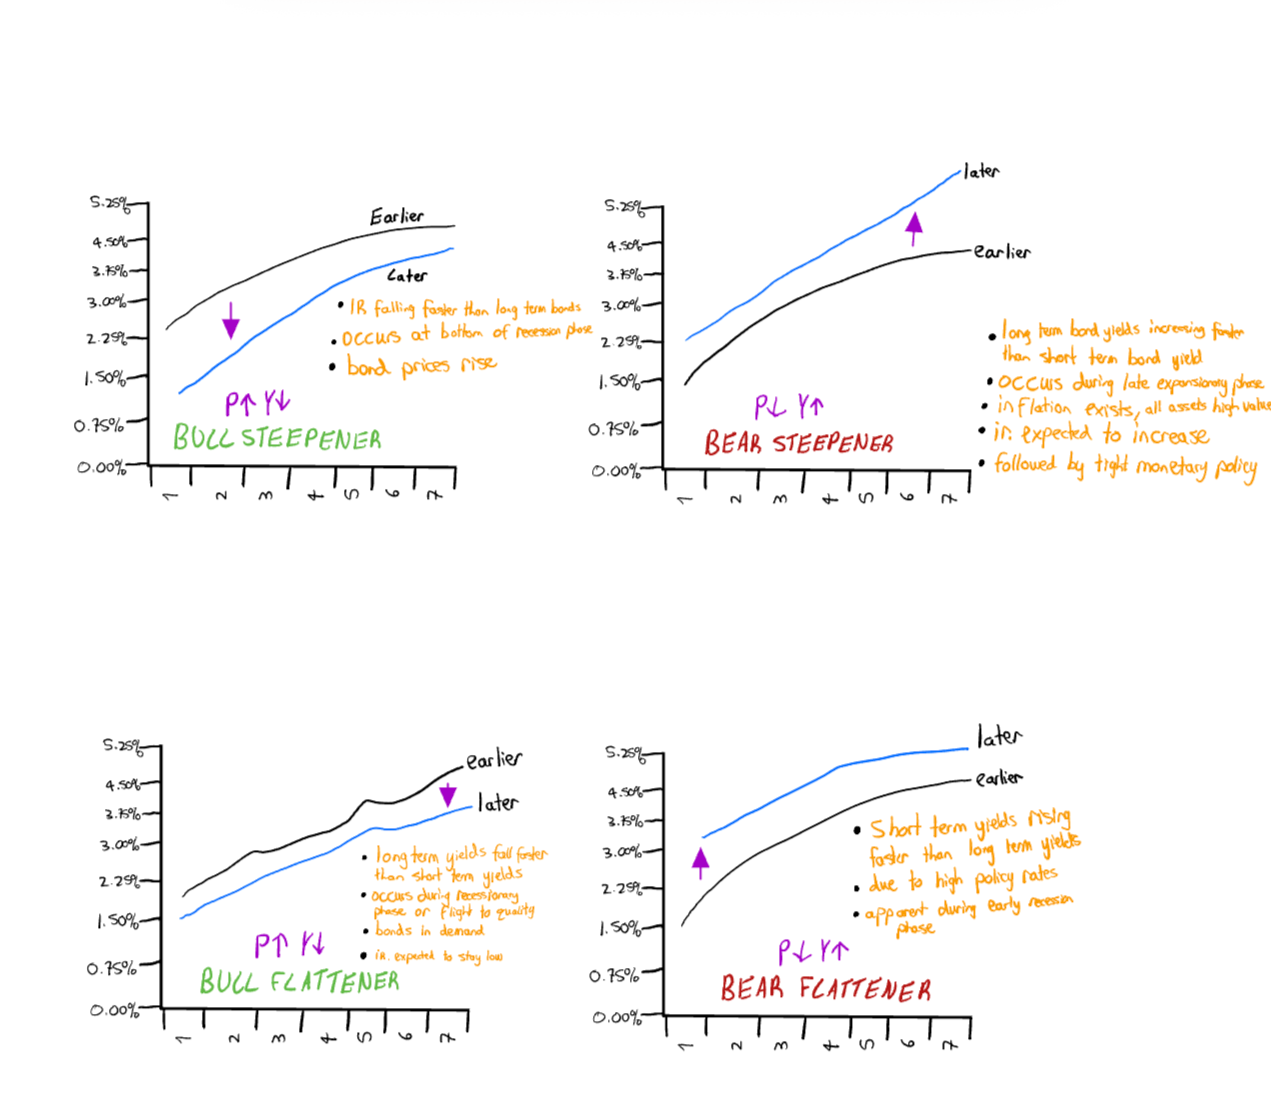
—- A bull flattener is “when yields on long term bonds are falling more quickly than yields on short term bonds” causing the yield curve to flatten. (Patel 2021)
What happens? Long term yields fall fast -> yield curve flattens and bond prices rise.
When does it occur? Often occurs during recessionary phases or “flight to quality” (when investors rush to safe assets like bonds)
Notes: bonds are in high demand
- markets expect inflation to lower and policy interest rates to remain low -> demand for bonds increases -> yields lower
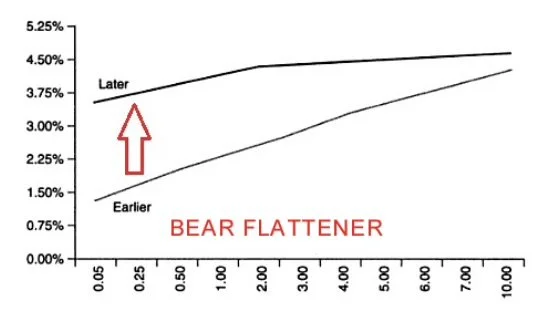
—- A bear flattener is when “short term yields are rising more quickly than long term yields” causing the yield curve to flatten. (Patel, 2021)
What happens? Short term yields rise quickly -> yield curve flattens -> bond prices fall
When does it occur? often seen during early recessionary phase
Notes: short term yields are high because of high policy interest rates
Steepener - bull and bear
There’s two more you need to understand: a bull and bear steepener.
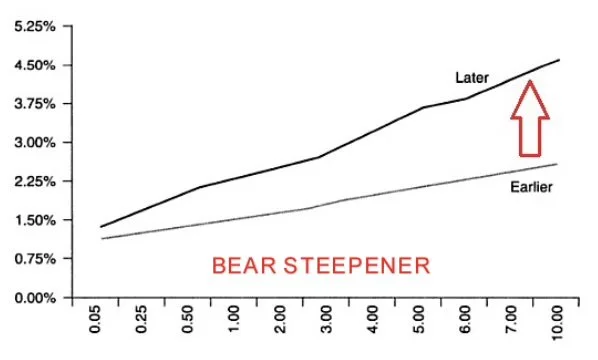
—- A bear steepener is when “yields on long term bonds rise more quickly than yields on short term bonds” causing the yield to steepen.
What happens? Long term bond yields rise quickly, the yield curve steepens and bond prices fall.
When does it occur? often seen during “Late expansionary phase when almost all asset classes rise in value, as well as inflationary pressures” (Patel 2021)
Notes: Investors expect interest rates to increase “reflecting investor expectations about rising inflation rates.” (Patel 2021)
- It is followed by tight monetary policy.
- So short term bonds which are dependent on cash rate would change quickly.
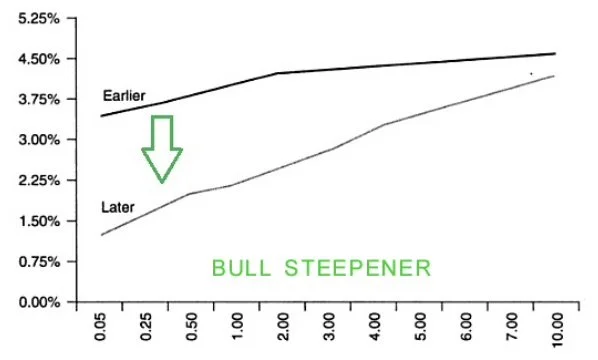
—- A bull steepener is when “interest rates on short term bonds are falling quicker than rates on long term bonds” causing the yield curve to steepen. (Patel 2021)
What happens? Short term bond yields fall, yield curve steepens, prices rise
When does it occur: Often occurs at bottom of recession phase
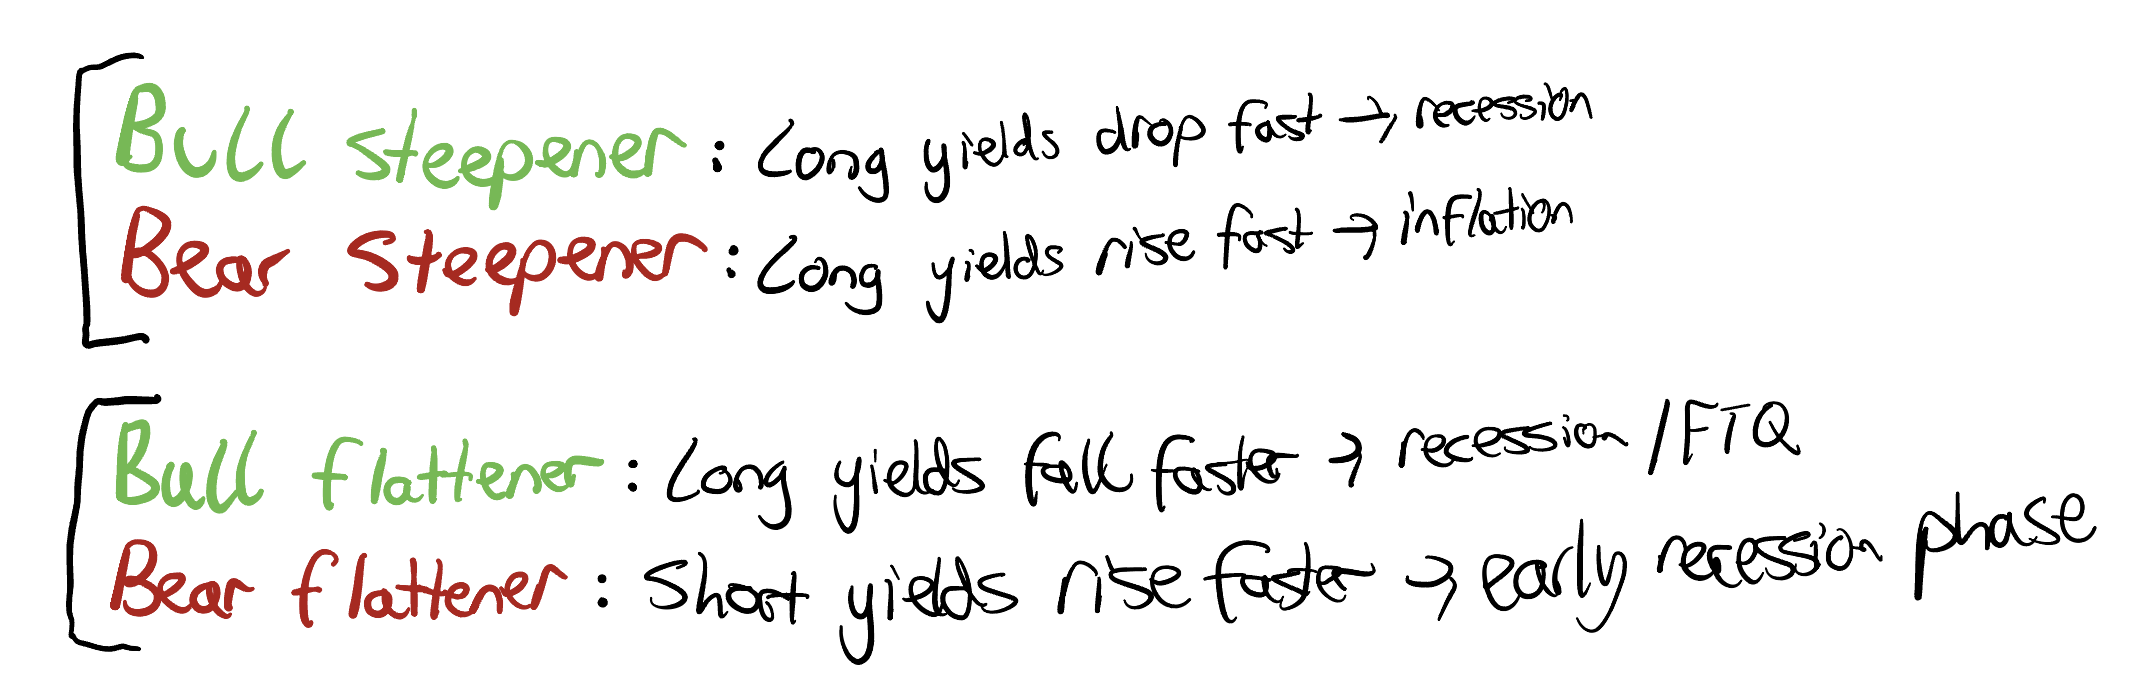
So just remember:
An example of a bear steepener:
Sourced from Millennial Revolution (2023)
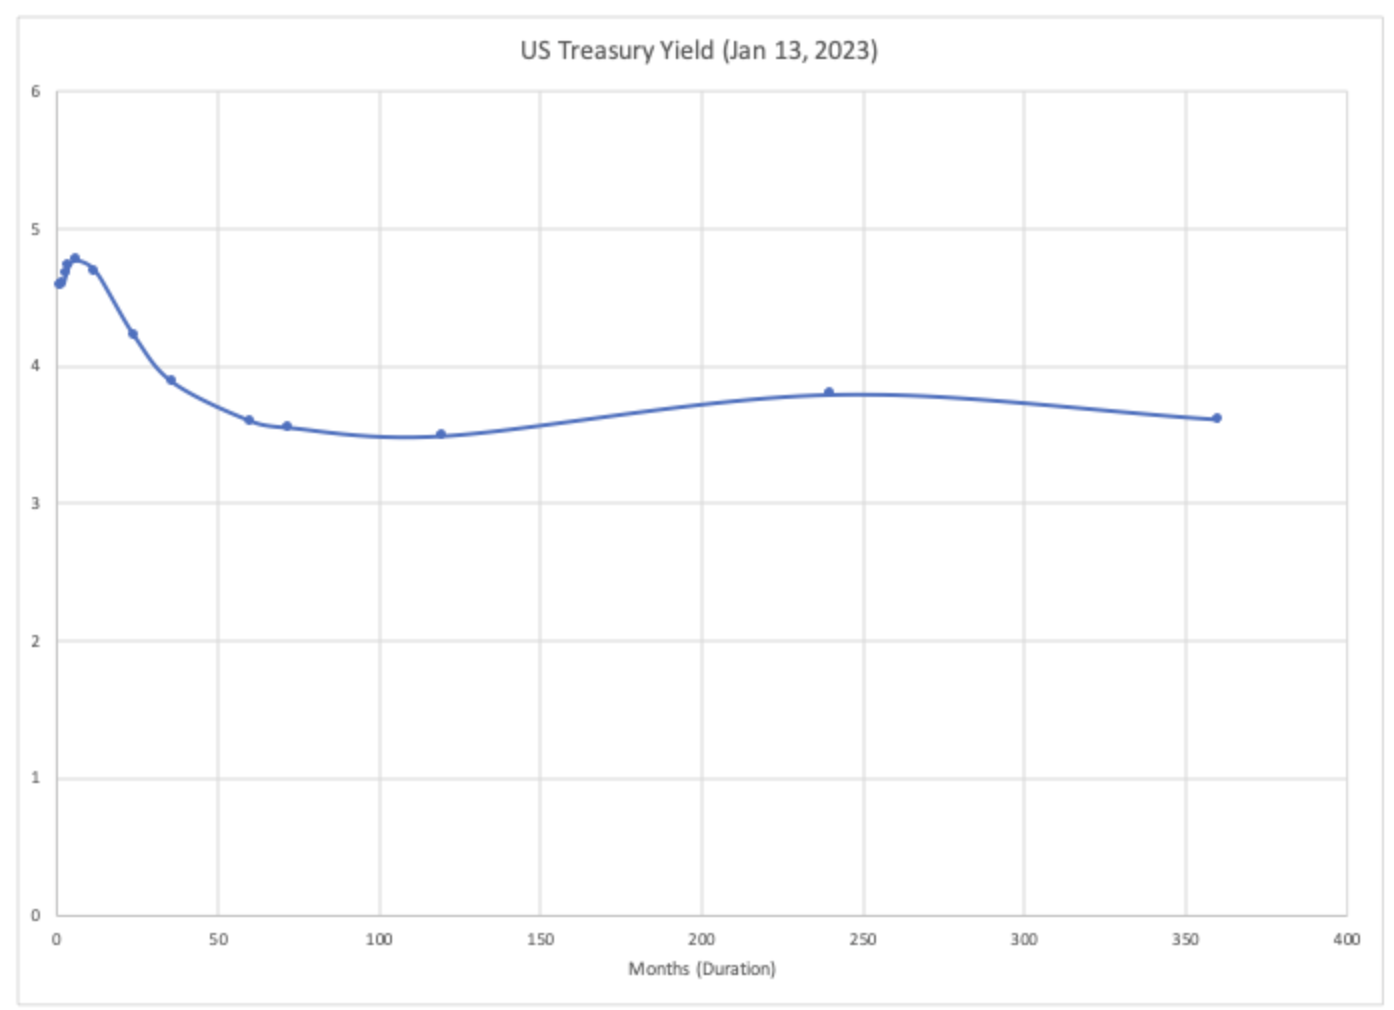
You may the recognise the above to be an inverted bond yield (short term yield > long term yield)
This inverted yield either means one of two things will happen (according to Millenial Revolution (2023):
1) A recession is incoming
2) Or bond traders think “oh the economy is going fine” and the bond curve flattens and then steepens.
This is shown below.

The curve has started steeping as shown above or, in other words, “un-inverted.” (Millennial Revolution, 2023)
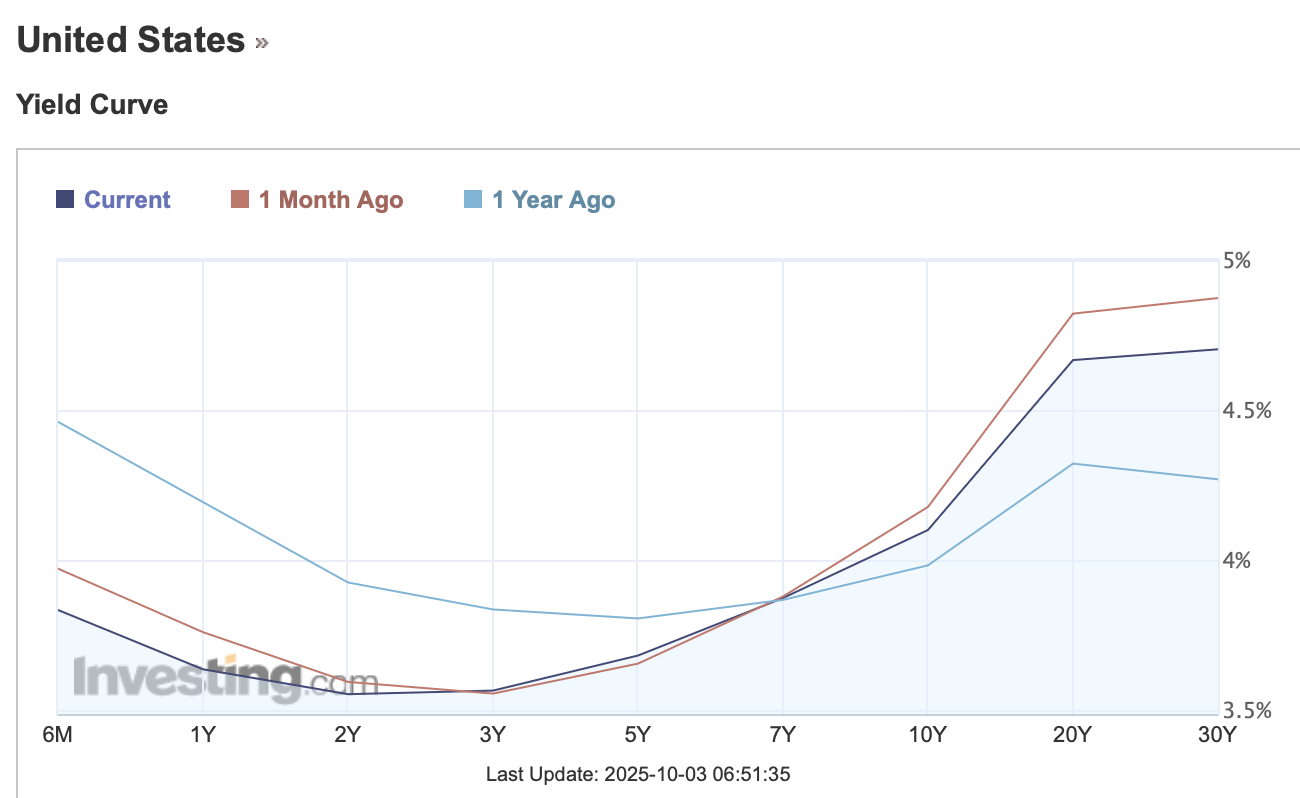
Now, in October of 2025 we can see (below) that the yield of short term bonds have moved inversely with long term bonds.
Because the yield of short term bonds (6m) has shifted down, we can assume the cash rate in the United States has decreased. For long term bonds - it’s the opposite: bond yields have increased likely due to inflation expectations. This is neither a normal, flat, inverted, flattened or steepened curve. That’s a topic for another day…
REFERENCES
Chappelow, Jim. “Recession Definition.” Investopedia, 8 June 2019, www.investopedia.com/terms/r/recession.asp.
Chen, James. “Flight to Quality Definition.” Investopedia, 21 Apr. 2022, www.investopedia.com/terms/f/flighttoquality.asp.
Millennial Revolution. “A Flattening Yield Curve: What Does It Mean?” Millennial Revolution, 9 Oct. 2023, www.millennial-revolution.com/invest/a-flattening-yield-curve-what-does-it-mean/. Accessed 3 Oct. 2025.
Patel, Vic. “Understanding Quantitative Easing by the Fed - Forex Training Group.” Forex Training Group, 14 Apr. 2021, forextraininggroup.com/understanding-quantitative-easing-by-the-fed/. Accessed 3 Oct. 2025.
Fact checked using assistance from Reddit users of an Economics subreddit and ChatGPT. (I hope that’s okay).
This is not financial advice - information may be incorrect.