
Waiting for the next big dip: Why the CAPE ratio is important
Liam Scotchmer
References listed below.
4 Minute Read
-One way to spot a market correction is by using the S&P500 CAPE ratio. (debated)
-CAPE ratio looks at "whether a stock price is moving up faster than the company's earning's can justify." (Kolkowski 2023)
- As of July 2025, the cape ratio stood at 37.8, compared with long term average of 18. (Jennewine 2025)
-This is close to the dot com bubble's CAPE ratio of 44. (Neufeld 2025)
-The current CAPE ratio has been fuelled by big tech rally and pandemic stimulus (Neufeld 2025)
-The ratio has some limitations
Key Points
So what's the issue?
There's debate around whether the current value of the CAPE ratio is a forewarning of an incoming market correction (aka crash). During the dotcom bubble, the CAPE ratio was 44 (Neufeld 2025), currently it is 38 as of July. (Jennewine 2025) According to Dorothy Neufeld (2025) the current CAPE ratio has been fuelled by pandemic stimulus and a big tech rally.
Firstly, what is the S&P500 CAPE ratio?
According to Investopedia, the CAPE ratio - cyclically adjusted price to earnings ratio - assesses whether the market is undervalued or overvalued, based on the stocks of the S&P500.
It is calculated by dividing the current price level of the S&P500 by their average inflation adjusted earnings over 10 years. It averages earnings over 10 years to adjust for economic cycles (that's an important point). It is also called the P/E 10. (Kolakowski 2023)
What does the CAPE ratio show?
Higher CAPE ratio's "means there is a wide gap between company earnings and their stock prices, reflecting outsized investor expectations [and optimism].” (Neufeld 2025) It may also predict incoming lower returns. (Jennewine 2025)
Why use the CAPE ratio?
Because fluctuations in profit due to economic cycles (such as recessions & expansions) can hamper with the precision of ratios like the PE ratio - we use the CAPE ratio. By averaging earnings over 10 years, it removes shorter term volatility, showing a smoother measure of “market valuation." (Kenton 2025)
Some examples of market corrections following peak CAPE ratios
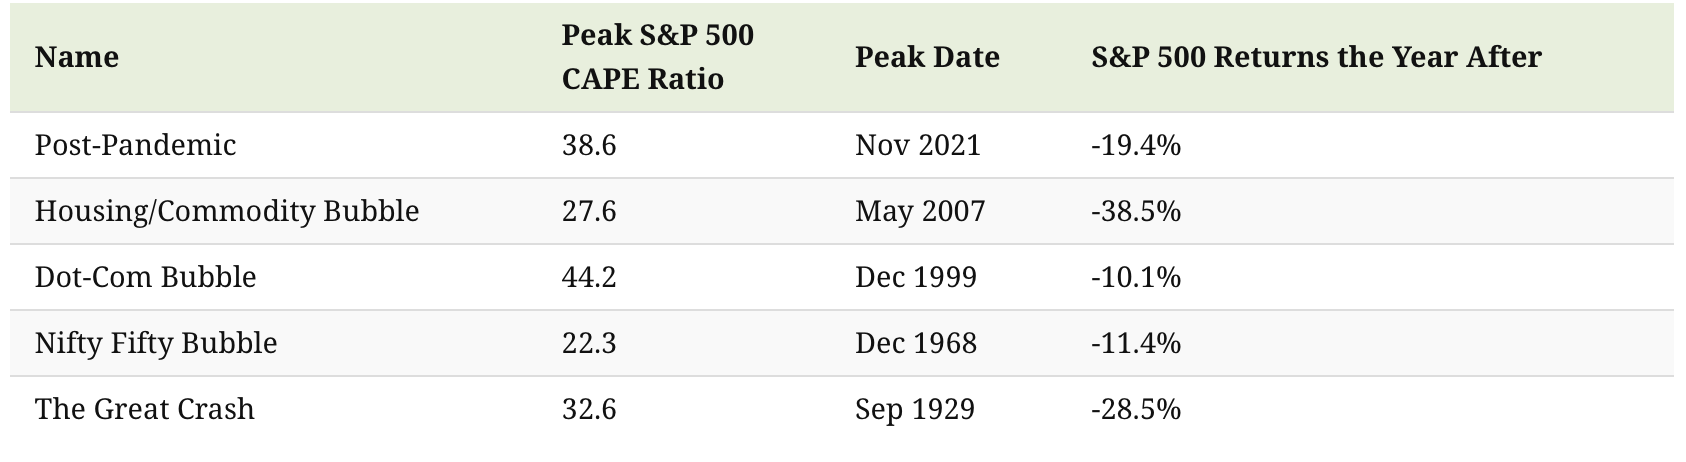
Source: Neufeld 2025
- During the Great Crash in 1929, the CAPE ratio hit 33, before falling to single digits, with the S&P500 returning -28.5% the year after.
- During the dotcom bubble of 2000, the CAPE ratio hit 44, before plummeting to 15, with the S&P500 returning -10% the following year.
Some limitations of CAPE ratio
We could predict past crashes like the Great Crash of 1929 and dot com crash of 2000 using the CAPE ratio… but only in hindsight - so there's discussion over whether it can really predict future outcomes.
In one article, the author introduces the issue saying, "there's raging debate over whether the elevated value of the ratio portends a major market correction." (Kenton 2025) In another, John Rekenthaler, vice president of research for Morningstar mentioned, "It's one thing to construct forecasts after the fact, when viewing the established history, but quite another to do so before the data arrives." (Kolakowski 2023)
Further limitations, according to Investopedia (Kenton 2025)
- The CAPE ratio looks at past data instead of future trends
- Relies on GAAP earnings- accounting results that may contain errors
- The results have been skewed by magnificent seven (my opinion -take with grain of salt)
Why is the CAPE ratio elevated, and is it justified?
Anyways, The CAPE ratio is certainly high, but it could be justified (I really hope so). The CAPE ratio may be elevated as the US has become the world's dominant economy and that could "justify an increasing earnings multiple for U.S. stocks" says Rob Arnott, CEO of Research Associates. (Kolakowski 2023)
In addition to this, there have been stricter financial reporting guidelines imposed - one article by Investopedia says the "quality of reported warnings today is arguably much higher than in 1929", and there was also the establishment of the Securities and Exchange Commission in 1934. "This has probably helped lift the CAPE by increasing confidence in U.S. markets." (Kolakowski 2023)
It’s difficult to write a conclusion, because what is the takeaway from this? Should we follow what history has shown us and fret over an incoming market correction, due to a high CAPE ratio, OR should we trust that current market prices are justified?
To learn more about how you can prepare, I suggest reading this article my cousin sent me :)
https://fortune.com/2025/09/22/ray-dalio-warns-very-dark-times-economy-america-china-great-power-conflict-inequality/?utm_source=flipboard&utm_content=fortune/magazine/Leadership
References
Gratton, Peter. “Securities and Exchange Commission (SEC) Defined, How It Works.” Investopedia, 12 July 2024, www.investopedia.com/terms/s/sec.asp.
Kenton, Will. “Understanding the CAPE Ratio.” Investopedia, 9 July 2024, www.investopedia.com/terms/c/cape-ratio.asp.
Neufeld, Dorothy. “The Bubble Indicator: Is the Stock Market Overheating?” Visual Capitalist, 14 Feb. 2025, www.visualcapitalist.com/sp/the-bubble-indicator-is-the-stock-market-overheating/. Accessed 23 Sept. 2025.
“Cyclically Adjusted Price-To-Earnings Ratio.” Wikipedia, 29 Apr. 2023, en.wikipedia.org/wiki/Cyclically_adjusted_price-to-earnings_ratio.
Jennewine, Trevor. “The Stock Market Flashes a Warning Seen during the Dot-Com Bubble. History Says the S&P 500 Will Do This Next.” Yahoo Finance, 17 Aug. 2025, finance.yahoo.com/news/stock-market-flashes-warning-seen-080200859.html. Accessed 23 Sept. 2025.
“Reddit - the Heart of the Internet.” Reddit.com, 2025, www.reddit.com/r/Economics/comments/1nljnbs/the_stock_market_flashes_a_warning_seen_during/. Accessed 24 Sept. 2025.
Kolakowski, Mark. “Why the 1929 Stock Market Crash Could Happen in 2018.” Investopedia, 2023, www.investopedia.com/investing/1929-stock-market-crash-could-happen-again/.