

What the yield curve (gov bonds) represents and how to use it
Liam Scotchmer
References listed below.
4 Minute Read
Intro
A bond is an IOU issued by a government or firm and purchased by any individual or firm called a bondholder. It is essentially a loan, except the borrower/lender situation is reversed.
In return, the bondholder receives the principal (amount lent) at maturity, and in the interim: receives interest payments called coupon rates. Additionally, the bondholder can trade their bond with other investors, creating a market… and we all know what markets mean: that prices are determined by the forces of supply and demand! Thus bonds vary in price at issuance and from issuance. (RBA, n.d.)
This is illustrated below.

This article is based on an educational sheet from the Reserve Bank of Australia (n.d) linked below.
The price of government bonds fluctuates: either at par, discount or premium, and in both the primary market (at issuance) and especially in the secondary market (where investors trade bonds).
Bond Yields
Therefore, investors use the yield to maturity (YTM) formula to calculate how much they expect to receive until the date of maturity (RBA n.d.) YTM accounts for changes in prices. In this article, when I say yield, I am referring to the yield to maturity formula.
Bond Prices and Yields
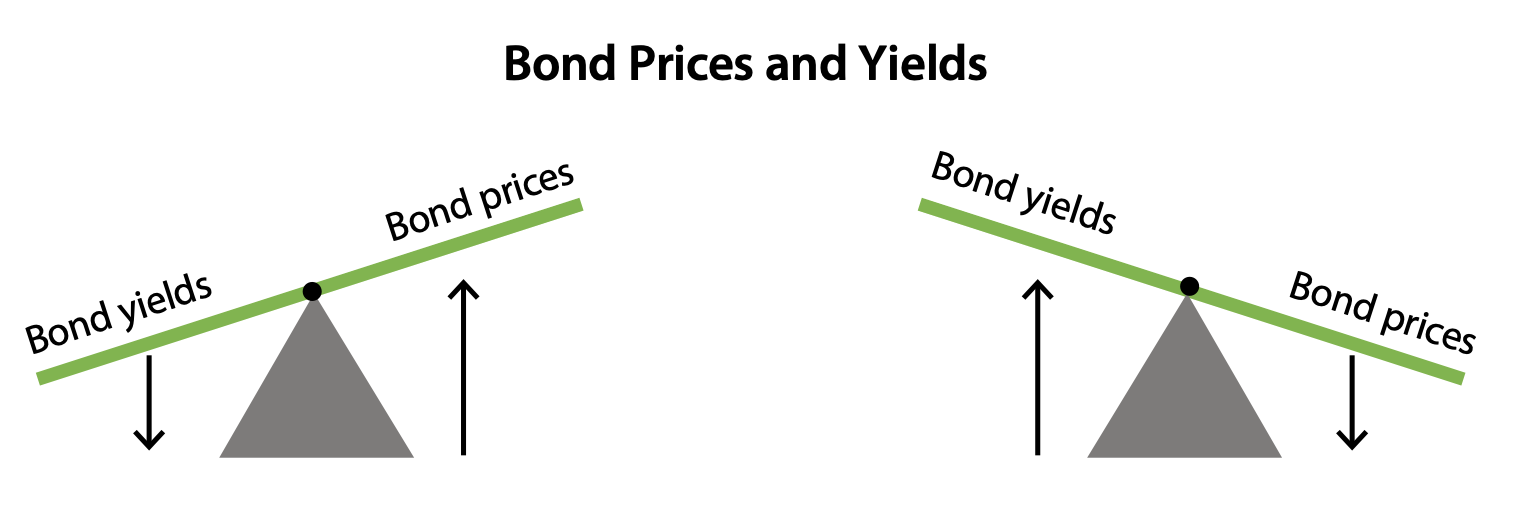
Now combining prices and yields:
Bond prices and yields are inverse.
-> Bond price up -> yield down
-> Bond price down -> yield up
The inverse relationship between bond prices and bond yields is obvious when comparing new bonds with a different coupon rate to old bonds.
For example:
-> Cash rate increased to 4%, so new bonds are issued at around 4% -> old bonds at 3% lose value because investors don’t want them/can seek better returns elsewhere, thus it’s price decreases until the YTM (return) aligns closely with the benchmark RBA rate.
-> Cash rate decreased to 2%, so new bonds are issued at around 2% -> old bonds at 3% increase in value because investors want them/they have better returns thus it’s price INCREASES until the YTM (return) aligns closely with the benchmark RBA rate.
In summary: you can see that bond prices and bond yields are inversely related and that the return eventually aligns closely with the benchmark RBA rate.
Source: Reserve Bank of Australia | Education
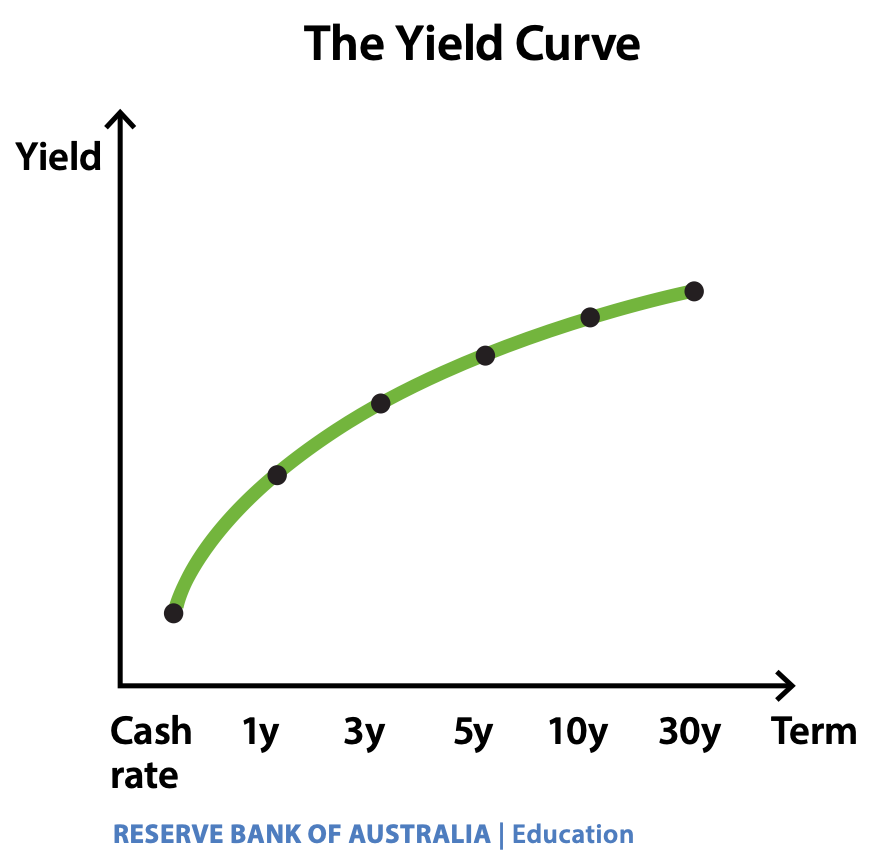
The Yield Curve for government bonds
“The yield curve is shorthand expression for the yield curve for government bonds.” (RBA n.d.)
According to the Reserve Bank of Australia (n.d.), the yield curve “shows the yield on bonds over different terms to maturity.”
Take a look at it: it is quite simple. It is graphed by plotting the yields on the y axis for bonds and at different maturity dates on the x axis (1y, 3y, 5y, 10y, 30y). Because it goes from short term, to long term, the cash rate (shortest term IR) in Australia is the beginning of the curve.
According to the Reserve Bank of Australia (n.d.) there are two “mains aspects of the yield curve that determine its shape:
the level and the slope.
The level is simple: “it’s determined by the interest rates in the economy” This is because it’s referred to as the “anchor” for the yield curve (well of course, it is the first thing to be plotted). The level changes up and down depending on the interest rate (shown below)
The Level of the Yield Curve
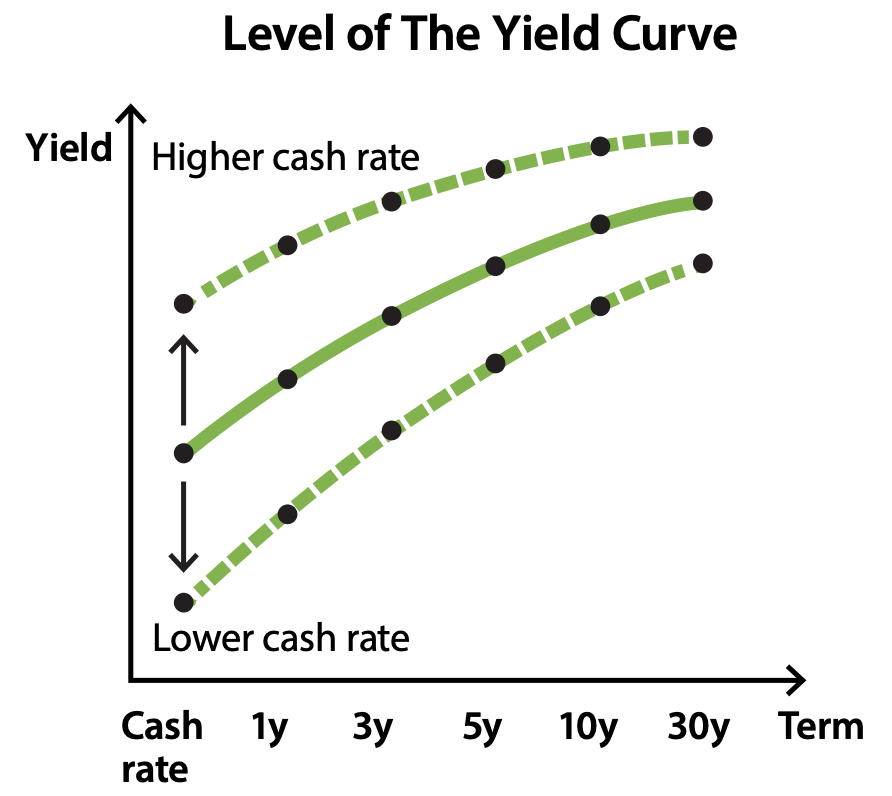
Because there’s uncertainty about what the cash rate or inflation will be in the future, there are differences in yields between short term bonds (1y) and long term bonds (10y). This is shown in the slope of the yield curve. (RBA n.d.)
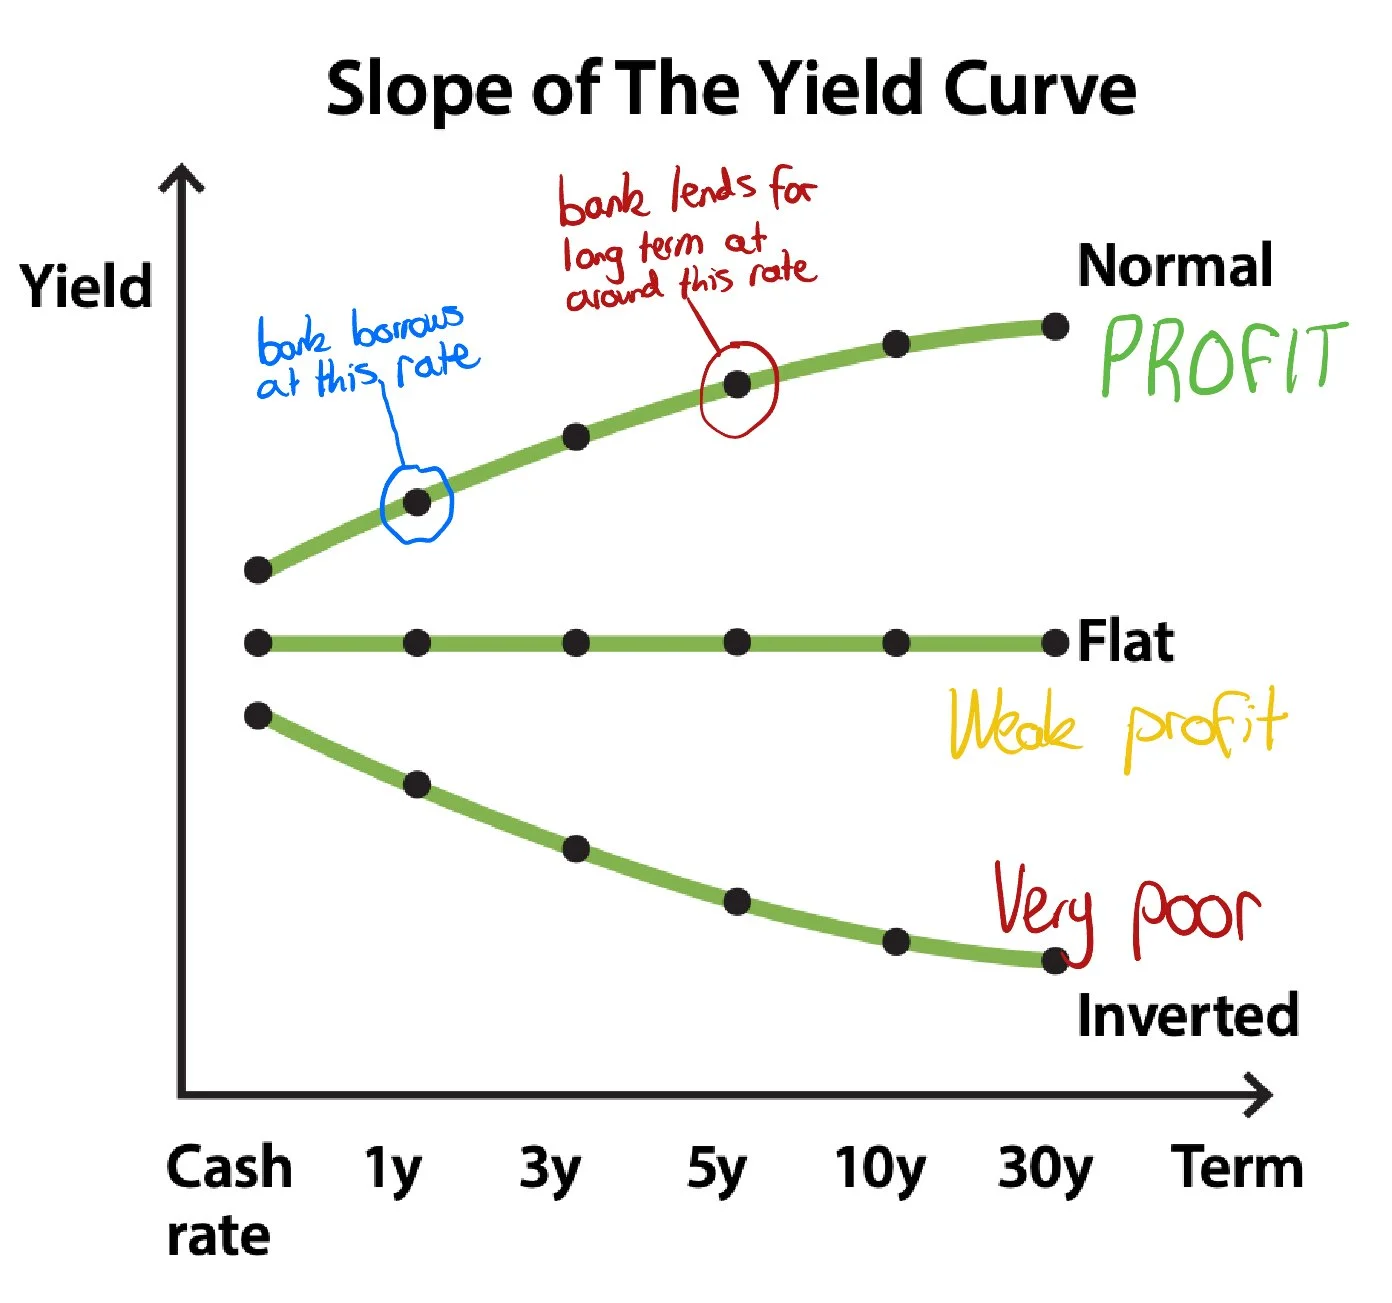
The Slope of the Yield Curve
This is considered the normal shape for the yield curve
Short term yield < long term yield
Intuition: Longer term bonds provide a higher yield, because as we said previously, there is more uncertainty/unpredictability around them: interest rates or inflation could rise.
— When does a normal yield curve occur?
A normal yield curve is “often observed in times of economic expansion, when economic growth and inflation are increasing” because during expansion expectations of inflation are higher so interest rates are anticipated to be increased. (RBA n.d.)
Normal yield curve (shown below)
An inverted yield curve:
Short term yields > long term yields
”The yield curve slopes downward.” (RBA n.d.)
— When does an inverted yield curve occur?
It occurs when investors think that the future policy interest rate will be lower than the current policy interest rate. (RBA n.d.)
Inverted yield curve (shown below)
Flat yield curve (shown below)

”A flat shape for the yield curve occurs when short term yields are similar to long term yields.” (RBA n.d.)
— When does a flat yield curve occur?
It occurs when the yield curve is “transitioning” between a normal and inverted shape and vice versa. (RBA n.d.)
Deep dive (for those with more time) Why is the Yield curve important?
According to the Reserve Bank of Australia (n.d.) the yield curve is an important economic indicator because of three reasons
The yield curve is considered the benchmark “risk free” yield curve, where interest rates for mortgages, costs of borrowing for businesses or banks and term deposits are added on top of the yield for this curve.
For example, say you take out a fixed rate 2 year mortgage - the bank will look at the yield for a bond maturing at 2 years and see a number; let’s say 3.5% - they will add on an additional percentage to cover costs, profit, and to compensate for risk of default by borrower. As you can see here, the yield curve at a specific maturity date is the benchmark for other interest rates.
Or if you take out a variable loan, the cash rate will be very important to you. (the first dot on the graph)
Or if the government or a firm borrows for 5 to 10 years, they will look at the benchmark rate for a bond maturing in 5 to 10 years. (4th and 5th dot on graph).
The yield curve is the benchmark
Investor’s expectations
According to the Reserve Bank of Australia, (n.d.) a normal, inverted or flat curve provides insight into what investors expect the future interest rates and inflation to be.
For example: if investors believe there will be inflation, they will also expect policy interest rates to rise, so the curve will shift upwards and look “normal.”
Bank profitability
The slope and level of the yield curve also affects the returns banks receive. It is important for banks to be profitable, as without them, credit wouldn’t be available which is “an important factor for economic growth and in particular for investment.” (RBA n.d.)
How it works, example:
-> for the long term, bank A creates a fixed rate loan
-> for the short term, bank A issues a bond at 1 year maturity
The rate on the longer term loan is greater than the rate on the shorter term bond
-> so banks lend for longer terms than they borrow
-> banks profit comes from the difference between long term and short term interest rates
(RBA n.d.)
Graphed below:
What causes the Yield Curve to change?
Changes in monetary policy (conventional)
Changes in cash rate (as explained earlier) change the level of the yield, up and down.
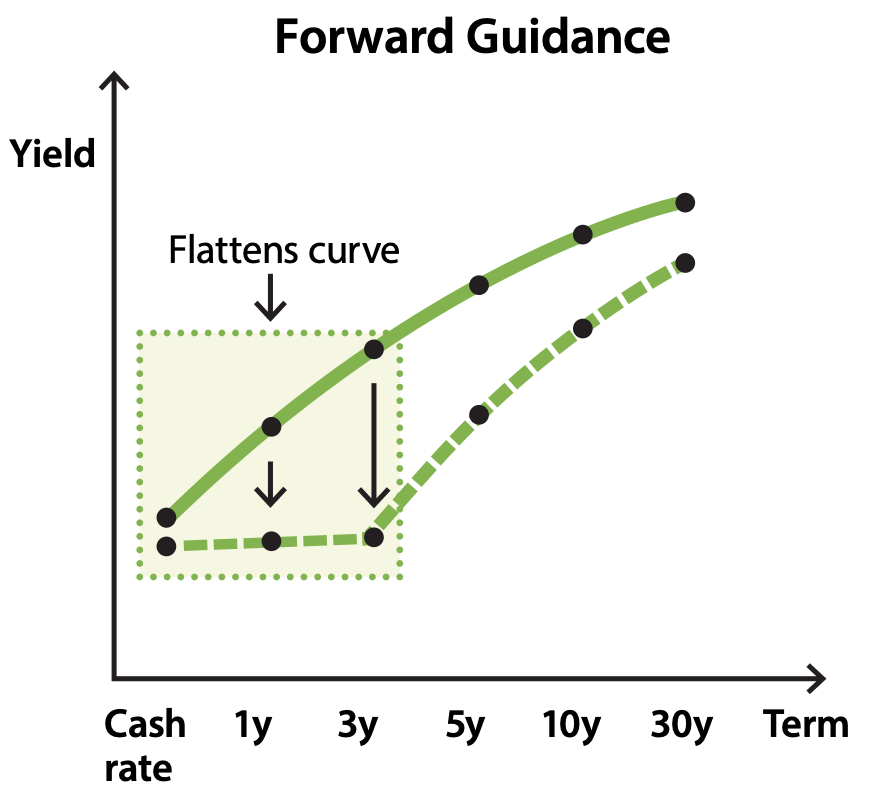
Forward guidance: Essentially, it is the bank providing guidance about where future policy interest rates will be. This usually happens when the RBA has hit its goal of both inflation and unemployment at good levels. This means inflation is low, and thus interest rates are likely to remain low, therefore demand for bonds rise, bond prices rise too, so yields on bonds in the short term will lower (and flatten in the graph up until the end of the guidance term), “and lower the whole yield curve further out.” (RBA n.d.)
Changes in monetary policy (unconventional)
Asset purchases by central bank
“Asset purchases” is when the central bank (RBA) purchases bonds in the secondary market. In doing so, this increases the demand for bonds, thus increasing bonds price and lowering their yield. Therefore the slope of the curve can be sloped more downwards or it can flattened, reducing the “premium” investors had previously needed to pay for to compensate for interest rate and inflation risk (called term risk).
The central bank (RBA) does this in two ways:
-> central bank targets quantity of bonds to purchase = goal is to lower yields across whole yield curve (because when RBA purchases bonds, prices rise, so yields decrease) this shifts the whole curve
-> central bank targets a yield on a specific segment of the curve purchasing whatever qty of assets is needed to achieve that target = this flattens part of the curve
This is shown below:

Demand & Supply of bonds
Like any market, prices (and yields of course!) are determined by supply and demand.
Demand
Demand for bonds increases when investors prefer bonds over alternative assets like shares "which is influenced by current policy interest rates and “expectations of future monetary policy and their perceptions of risk.” (RBA n..d)
When demand increases, ceteris paribus, prices rise and yields fall until they align with RBA benchmark rates.
When demand decreases, ceteris paribus, prices fall and yields rise until they align with RBA benchmark rates.
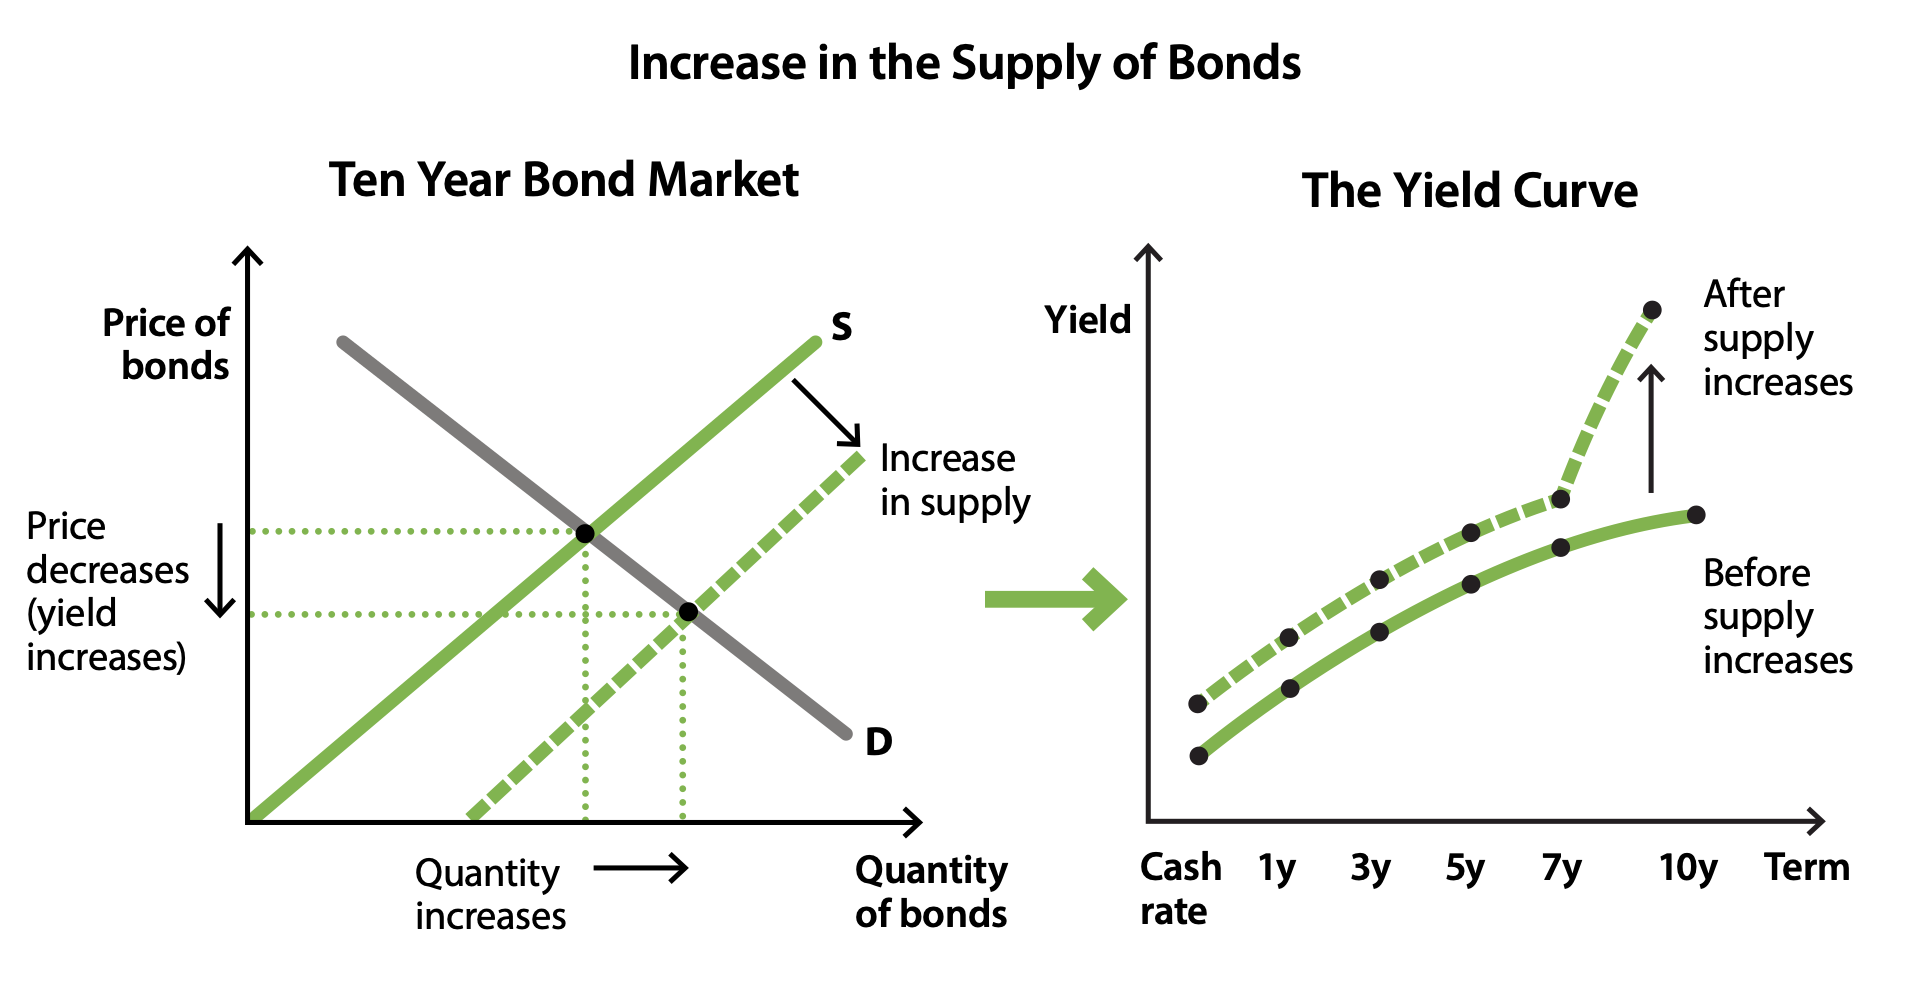
Supply depends on how much borrowing issuers would like to expend.
If the supply of bonds increases, price falls and yields increase
If the supply of bonds decreases, price increases and yields decrease
Supply
Graphing changes in demand and supply on yield curve
Whether a change shifts the whole curve or affects only a particular segment of the curve depends on the change.
Whole curve: like we said earlier, policy interest rate changes (conventional!), asset purchases (qty)
Particular segment: issuance of a particular segment called asset purchases (price), forward guidance (unconventional!)
An example for an increase of supply in ten year bonds:
Other notes from the Reserve Bank of Australia’s article:
Credit risk: Government bonds are considered to be safe and default risk free: called having a very low credit risk. This is compared to corporate bonds where the firm may be less likely to pay the principal who have a higher credit risk. (RBA n.d.)
The yield for corporate bonds are generally higher than government bonds because they are considered riskier and harder to sell. This is called liquidity risk.
REFERENCES
This article was based on this factsheet:
Reserve Bank of Australia. “Bonds and the Yield Curve.” Reserve Bank of Australia n.d.
https://www.rba.gov.au/education/resources/explainers/pdf/bonds-and-the-yield-curve.pdf?v=2025-09-30-18-30-27
Fernando, Jason . “Yield to Maturity (YTM).” Investopedia, 2022, www.investopedia.com/terms/y/yieldtomaturity.asp.
None of this is financial advice, may contain errors.